veheeavis
veheeavis is a JavaScript library for visualizing Vehicle Electrical/Electronic Architectures(EEA).
veheeavis = Vehicle Electrical/Electronic Architecture Visualizer


Read more about veheeavis at VehEeaVis-Demo
The library can be installed by running:
$ npm install veheeavisSample
The sample demonstrates the construction of a graph representing the electrical architecture of a Cybertruck.
<body>
<h1>veheeavis Example</h1>
<h2>Cybertrcuk-EEA</h2>
<div id="diagram"></div>
<!-- import veheeavis.js -->
<script src="veheeavis.min.js"></script>
<script>
const jsonData = {
modules: [
{ id: "1", name:"AutopilotECU", type: "ECU", position: { x: 350, y: 50 , width: 150, height:100, color: '#ccc'},
leftArray: [{portid: "leftport0", portcolor:0},{portid: "leftport1", portcolor:1}],
rightArray: [{portid: "rightport0", portcolor:0},{portid: "rightport1", portcolor:1}],
topArray: [{portid: "topport0", portcolor:0}],
bottomArray: [{portid: "bottomport0", portcolor:0},{portid: "bottomport1", portcolor:1}]
},
{ id: "2", name:"LeftController", type: "ECU", position: { x: 100, y: 150 , width: 150, height:60, color: '#ccc'},
leftArray: [],
rightArray: [{portid: "rightport0", portcolor:0},{portid: "rightport1", portcolor:1}],
topArray: [],
bottomArray: []
},
{ id: "3", name:"RightController", type: "ECU", position: { x: 550, y: 160 , width: 150, height:80, color: '#ccc'},
leftArray: [{portid: "leftport0", portcolor:0},{portid: "leftport1", portcolor:1},{portid: "leftport2", portcolor:0}],
rightArray: [{portid: "rightport4", portcolor:0},{portid: "rightport5", portcolor:1}],
topArray: [],
bottomArray: [{portid: "bottomport4", portcolor:0},{portid: "bottomport5", portcolor:1}]
},
{ id: "4", name:"RearController", type: "ECU", position: { x: 350, y: 300 , width: 150, height:80, color: '#ccc'},
leftArray: [{portid: "leftport0", portcolor:0}],
rightArray: [{portid: "rightport4", portcolor:0},{portid: "rightport5", portcolor:1}],
topArray: [{portid: "topport4", portcolor:0},{portid: "topport5", portcolor:1}],
bottomArray: []
}
],
connections: [
{ from: "AutopilotECU", to: "LeftController" ,fromPort: "leftport0",toPort:"rightport0",points:[10,20,]},
{ from: "AutopilotECU", to: "RightController", fromPort: "rightport0",toPort:"leftport0"}
]
};
const myveheeavis = new veheeavis.Ploteeavis({
container: '#diagram',
data: jsonData
});
</script>
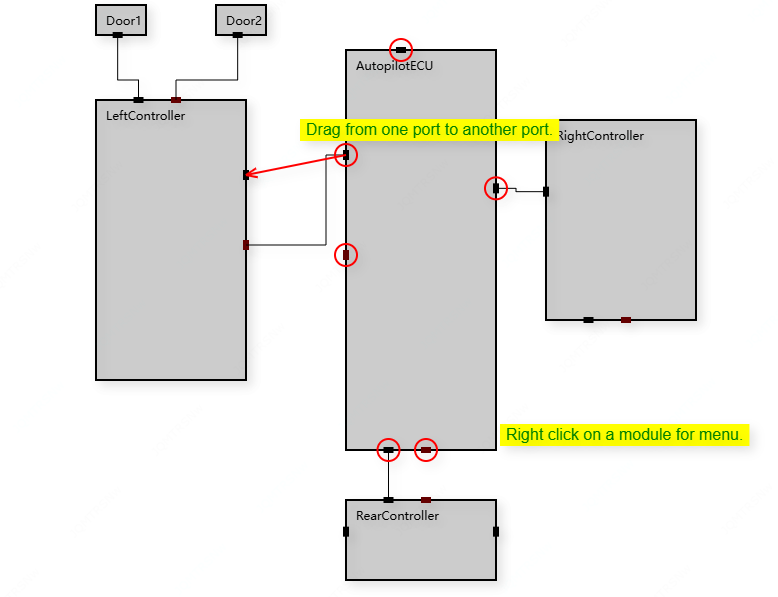
</body>The rendered result will look like this; you can also visit the link to customize it yourself VehEeaVis-Demo.
Support
please visit contact form.
License
The veheeavis software license.
Copyright@ ZongL